Some time ago I wrote a blogpost on how to compare different time series and plot them on the same axis. This blogpost was using a rather complex table calculation to calculate the days since start of each different time series and use that as an axis. In this blogpost I will demonstrate an easier way to achieve this, including a proper data axis.
1. Working example
I’ve created this example using the Superstore dataset that is included with Tableau. To create it yourself you need to create 3 parameters and two calculated fields.
2. Parameters
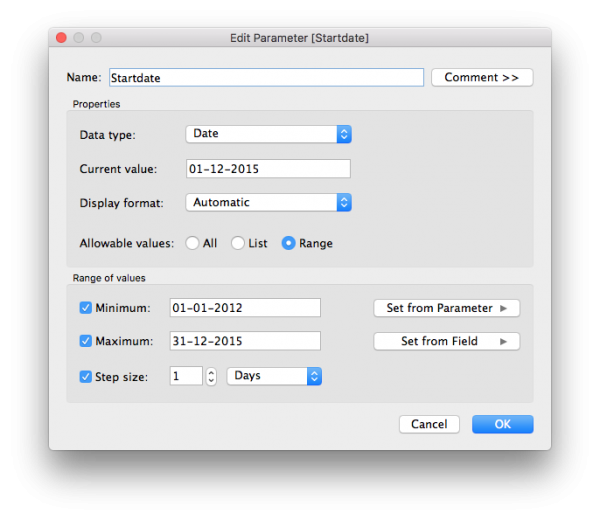
Parameter: Start date
I created a Startdate parameter with Data Type “Date” with a current value of december 1st, 2015 and the minimum and maximum values are set from field “Order date” restricting input to the available data. I’ve also set the step size to 1 
Parameter: End date
I have made a similar parameter for selecting the Enddate, I used december 31st, 2015 as the current value and just like the Startdate the minimum and maximum are set by the Orderdate field. You can do this quickly by duplicating the Startdate parameter and adjusting the current value. 
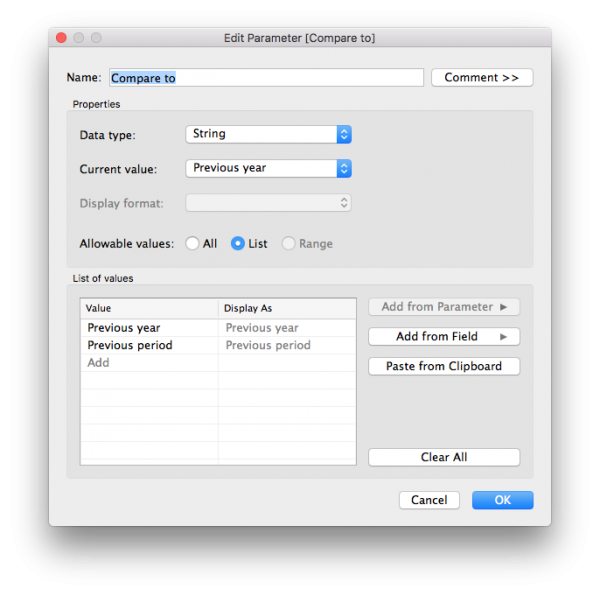
Parameter: Compare to
The last parameter I am creating is used to select the reference period. This can be the directly preceding period or the same period last year. I used a Data Type “String” for this parameter and selected “List” for the allowable values. I then entered the two options in the list. 
Showing parameter controls
Right-click on the parameters and select “Show parameter control” to enable the parameter-controls on your sheet. 
3. Calculated Fields
Next we create two calculated fields that will split the dates into reporting/reference and other dates and create a new date field.
Calculated field: Period
The first calculation will determine the current period, the reference period and ‘other’ period based on Order date and the selections made in the parameters.
CASE [Compare to]

WHEN "Previous year" THEN

IF

[Order Date]>=[Startdate]

AND

[Order Date]<=[Enddate]

THEN "Reporting period"

ELSEIF

[Order Date]>=DATEADD('year',-1,[Startdate])

AND

[Order Date]<=DATEADD('year',-1,[Enddate])

THEN "Reference period"

ELSE "Other"

END

WHEN "Previous period" THEN

IF

[Order Date]>=[Startdate]

AND

[Order Date]<=[Enddate]

THEN "Reporting period"

ELSEIF

[Order Date]>=DATEADD('day',DATEDIFF('day',[Enddate],[Startdate])-1,[Startdate])

AND

[Order Date]<=DATEADD('day',-1,[Startdate])

THEN "Reference period"

ELSE "Other"

END

END
Calculated field: New Order Date
This second calculation will create a new date field. If we compare to previous year, we’ll add 1 year to the Order Date of the reference period in order for it to overlap with the reporting period. When we compare to previous period we’ll add the difference in days between Enddate and Startdate again causing to overlap with the reporting period.
CASE [Compare to]

WHEN "Previous year" THEN

IF

[Order Date]>=DATEADD('year',-1,[Startdate])

AND

[Order Date]<=DATEADD('year',-1,[Enddate])

THEN

DATEADD('year',1,[Order Date])

ELSE

[Order Date]

END

WHEN "Previous period" THEN

IF

[Order Date]>=DATEADD('day',DATEDIFF('day',[Enddate],[Startdate])-1,[Startdate])

AND

[Order Date]<=DATEADD('day',-1,[Startdate])

THEN

DATEADD('day',DATEDIFF('day',[Startdate],[Enddate])+1,[Order Date])

ELSE [Order Date]

END

END
[Bonus] Calculated field: Warning
As endusers are able to select an Enddate that lies before the Startdate we’ll give a warning as well as when people select a reporting period longer then 1 year because then compare to last year will not work.
IF

[Startdate]>=[Enddate]

THEN "Please select an Enddate that lies after your Startdate"

ELSEIF

(DATEDIFF('day',[Enddate],DATEADD('year',1,[Startdate]))<=0)
AND

[Compare to]="Previous year"

THEN

"Warning: You selected a datarange longer then 1 year and Compare to 'Previous year'. Please use 'Previous period' instead."

ELSE

""

END
4. Sheet setup
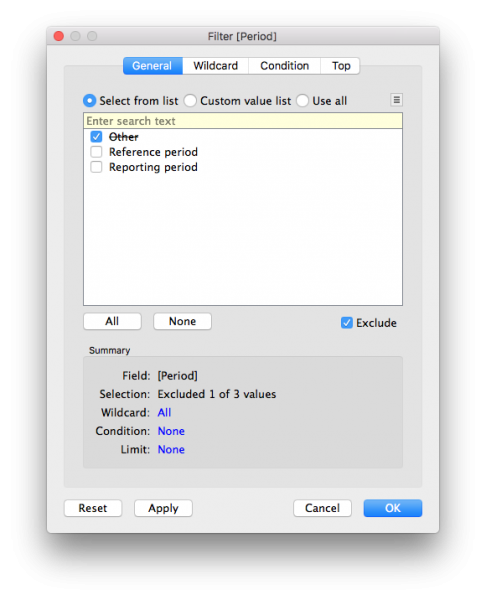
Now that we’ve created everything necessary to create the visualisation I’ll show you how to setup your worksheet. Step 1. Drag ‘Period’ to Filter and Exclude Other  Step 2. Drag ‘New Order Date’ to columns and make it Continuous (Green) at the day level.
 ![]() Step 3. Drag ‘Period’ to Color
Step 3. Drag ‘Period’ to Color  Step 4. Drag ‘Sales’ to Rows
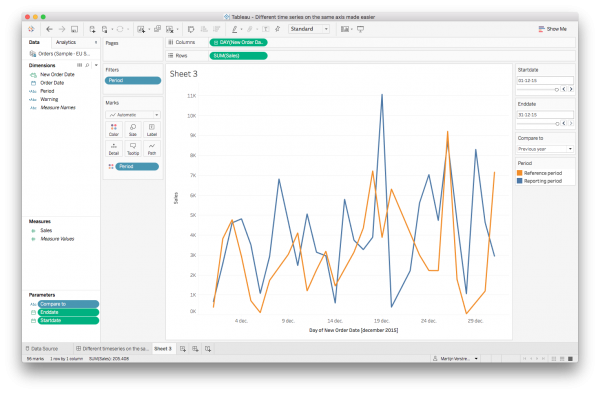
 ![]() Step 5. End result
Step 5. End result  Step 6. [Bonus] Create a new sheet and put ‘Warning’ on Text in the Marks card and combine both sheets on a dashboard.
Let me know what you think of this technique. Is it useful for you? Also, if you have any questions feel free to ask by leaving a comment below.

Hi Martijn,
have one sales data its a daily sales data for different location for the same product. I want to show last 7,120, days sales and Y-o-Y sales growth on same sheet am not able to set this format or calculations fields. can you please help me out
Hi Swapnil, I don’t think I completely understand the end result you’re aiming for. Could you share a mockup via email that shows what you’re trying to create?
Hi Martijin, I checked the blog. However, it seems like the tooltip is not showing the right date for the reference period. it shows the same date for current and reference period. Is there a way to fix it?
Hi Rachel, yes this would be possible by dragging [Order Date] to Tooltip on the Marks card and editing the tooltip to not show the [New Order Date] line. I’ve adjusted the example on Tableau Public to reflect this.
Hi Martijin,
I’m having a problem with the reference period while reporting in “Previous Period”. The date range that I have selected is 12/24-12/30, which is a 7 day period. When I choose “Previous Period” Tableau displays 12/18-12/23, cutting me short by one day. Is there any way to get the 17th to display in the reference period in order to get both periods to display 7 days worth of data?
Hi Dominic, thank you for pointing that out. I’ve adjusted the calculations so that it now calculates correctly.
Can you please post the corrected version
Hi Shashank, the corrected is version is updated on Tableau Public and in the code on this site.
Hi,
Is there any way to default the end date to the most current day (or in my case, week)?
Hi Gary, yes that should be possible, but not by defaulting the parameter to the latest day/week as parameters are static. You could however adjust the calculation to not look at the parameter value but at TODAY() for today or DATETRUNC(‘week’,TODAY()) for the first day of this week.
Hi,
I am having trouble replicating the Period to filter. When I drag it over to the the filter, I dont see the “Other”, “Reporting Period”, and “Reference Period” showing up. All I see is null.
Any Idea what is going on? Otherwise Everything is the same including formulas.
I had to adjust the capitalization of my reference. Caps matters!
I am getting Null as the only option as well and I have checked and rechecked everything. 🙁 Is there anything else that could be causing it?
Hi Rachel, null values indicate that there is a missmatch between your test in the IF statement. Have you selected valid dates for your parameters that match your dataset?
Hi,
Thanks for sharing this. Amazing.
Could you please share the link to the viz on Tableau Public also to your profile to Tableau Public that would be great.
Thanks,
Maz
Thank you Maz, you can find my Tableau Public link in section 1: working example. At the bottom you can click through to the viz on Tableau Public or select my profile.
Hi Martijn, the formula you uses doesn’t seem to account for leap years when deducting a year and would result in data on the 29th to be dumped with March data. How would you address that?
Hi Jacob, that is correct. It’s deducting one year using the dateadd function (returning March 1st for the reference). If you would like different behavior (making your reference 1 day shorter compared to the actual) you could test for a leap year and adjust the formula.
Hello Martijn,
Thank you so much for making this viz so much easier for me and the end user! Have you come up with a calculation that allows the end user to choose Days, Weeks, Months, or Quarters instead of just showing days?
Hi Rachel, sorry, that wouldn’t be possible as it would require the parameters to change their level of detail.
Hi Martin,
Incredible stuff ! Thank you. In my case I would like to show multiple reference periods (ex: reporting year is 2017, but I want to show 2015, 2016 as reference years) how can i make the adjustment in the code? My data isn’t layered in specific dates rather every row is just 1/1/2016, 2/1/2016 and so on.I had to use a list in the parameter design to create this. How can i change this to show Month without making it a string? I’d like the user to select month instead of dragging the cursor to change between 1/1/2017 to 2/1/2017.
This is a gorgeous workaround, thanks for sharing!
Hi Martijn,
This is really a wonderful article. It helped me a lot. I actually wanted to replicate graphs of Google analytics in Tableau. Everything is available in your article except, Custome date selection.
Can you add one more parameter as Custome which will ask the user to fill in custom start date and Enda date? It would be a great help to me.
Also, can you please let me know if you are comparing Monday to Sunday of this year vs Monday to Sunday of Previous year or it is date comparison like 1-jan 2019 to 1-jan 2018?
Please reply to me.
Regards,
Nipa
Hi, thanks for the tutorial.
However I don’t get the part with “New Order Date”. In the formula you only calculate for one day, e.g. DATEADD(‘day’,DATEDIFF(‘day’,[Startdate],[Enddate])+1,[Order Date]), and then you put it in the Columns.
How come Tableau manages to show all dates? I tried to replicate with my own data but I only see one data point.
Thanks in advance! I’m pretty sure I missed something important.
Hi Markus, the calculation actually calculates the difference between the start date and end date and then adds this difference in days to the order date field for every line in your dataset.
Hey,
The problem with this approach that I’m finding is that the parameter can only be a singular return at a time. Meaning that ‘Current Period’ vs. ‘Reference Period’ can’t be simultaneously evaluated by Tableau; and so the filter can only provide what is being returned at that moment in time through the use of either the “Current Value” of the parameter, or what the user selects in the Parameter Control. Unsure how to work around that!
Thanks for the info though – pretty interesting!
Hi. Thank you for this!
I am also having trouble replicating the Period to filter. When I drag it over to the filter shelf, I don’t see the “Other”, “Reporting Period”, and “Reference Period” showing up. I only see “Reporting period.”
My date range is 1/1/2019 to 06/01/2021
Thank you!