
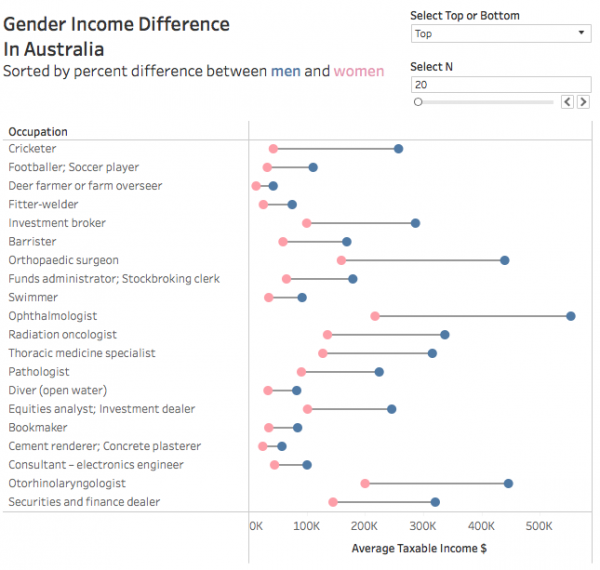
My 2017 new year resolutions include participating in Andy Kriebel and Eva Murray’s #makeovermonday every week. For week I looked at a dataset that reported on Gender Income Difference in Australia. I decided to sort the list by percent difference between men and women and give the end-user the ability to choose to have a look at the bottom or top N using a parameter. To show the gap I chose to use a barbell plot. You can view the interactive visualisation by clicking on the image.
#MakeOverMonday 2017 Week 1