Talk Date To Me

Martijn Verstrepen

Powered by
Martijn Verstrepen

#MakeOverMonday Week 4 2017

24 januari 2017 by talkda-6481b375f2a76

New Zealand will always be a very special place to me, we spent a little over 4 weeks there during Christmas of 2009 and I proposed to my wife on Christmas morning at the foot of Fox Glacier. So for this week of #makeovermonday we’re looking at the Regional Tourism Index of New Zealand. I decided to create a trellis chart showing all the different regions in one overview and highlighting those that are outperforming the index for at least one year x amount of times.

You can view the interactive visualisation on Tableau Public by clicking on the image.

Filed Under: makeovermonday, Tableau Public, Tableau Software

#MakeOverMonday Week 3 2017

16 januari 2017 by talkda-6481b375f2a76

This week in #makeovermonday we looked at the tweets of President Elect Donald Trump gathered by the Trump Twitter Archive. I decided to have a look at the hashtag trump is using and how ofter they get retweeted. To do this I split the content of the tweets on the space character and then pivoted those fields to get a single column with the individual words in the tweets. I used that data in a Wordcloud highlighting those that contain the word “Trump” in a different color. By selecting any of the hashtags you can see a top 10 list of the tweets they were used in. You can view the interactive visualisation on Tableau Public by clicking on the image.

#MakeOverMonday 2017 Week 3

#MakeOverMonday 2017 Week 3

Filed Under: makeovermonday, Tableau Public, Tableau Software

#MakeOverMonday Week 2 2017

9 januari 2017 by talkda-6481b375f2a76

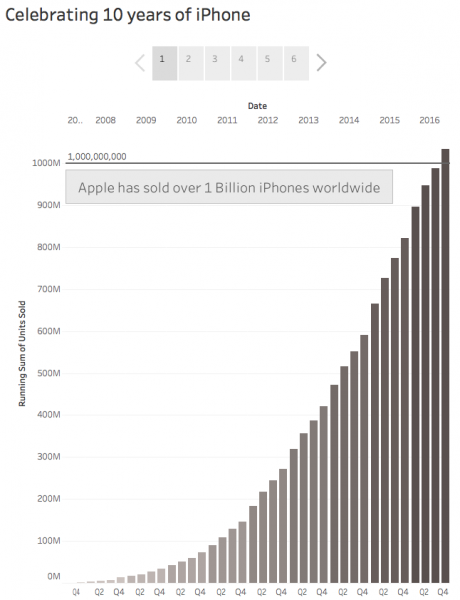
For week 2 of #makeovermonday I looked at the iPhone sales per quarter since the launch of the first iPhone. This week I decided to create a Tableau Story highlighting some of the interesting insights I found in the data. I looked at the total of units sold (over 1 Billion!), I highlighted seasonality in the data and looked at the percent change compared to the same quarter last year. You can view the interactive visualisation by clicking on the image.

#MakeOverMonday 2017 Week 2

#MakeOverMonday 2017 Week 2

Filed Under: makeovermonday, Tableau Public, Tableau Software

#MakeOverMonday Week 1 2017

2 januari 2017 by talkda-6481b375f2a76

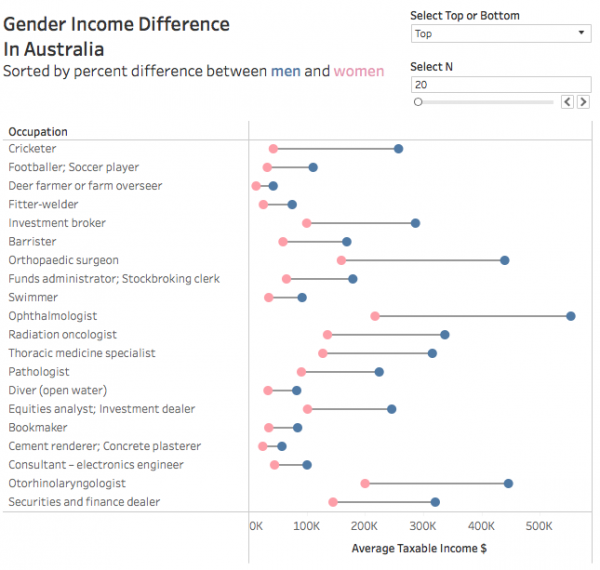
My 2017 new year resolutions include participating in Andy Kriebel and Eva Murray’s #makeovermonday every week. For week I looked at a dataset that reported on Gender Income Difference in Australia. I decided to sort the list by percent difference between men and women and give the end-user the ability to choose to have a look at the bottom or top N using a parameter. To show the gap I chose to use a barbell plot. You can view the interactive visualisation by clicking on the image.

#MakeOverMonday 2017 Week 1

#MakeOverMonday 2017 Week 1

Filed Under: makeovermonday, Tableau Public, Tableau Software