
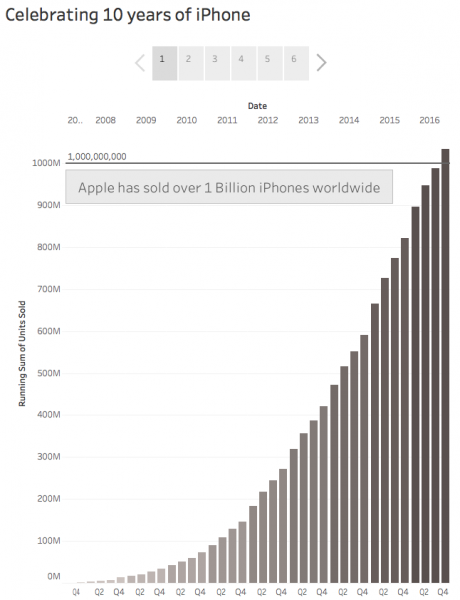
For week 2 of #makeovermonday I looked at the iPhone sales per quarter since the launch of the first iPhone. This week I decided to create a Tableau Story highlighting some of the interesting insights I found in the data. I looked at the total of units sold (over 1 Billion!), I highlighted seasonality in the data and looked at the percent change compared to the same quarter last year. You can view the interactive visualisation by clicking on the image.
#MakeOverMonday 2017 Week 2