
Reporting on the most visited pages within your website can be a rather static endeavor if your most popular content doesn’t change very often. Changing this report to a list of pages with the largest change (both positive and negative) in visits is most likely a lot more interesting.
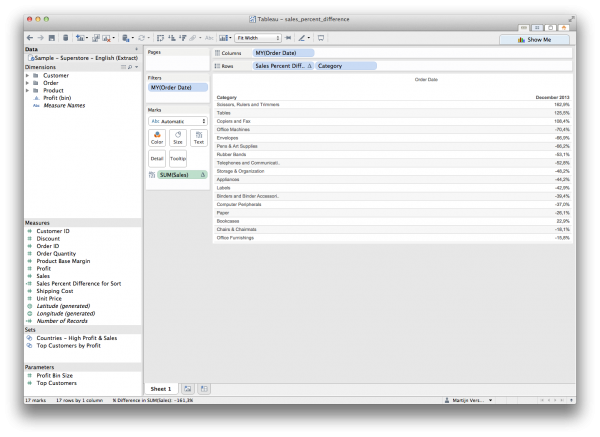
Tableau Absolute Sorted
I often look at a top sorted list for both percent change and absolute change. Both are available as quick table calculations but it requires a bit more work to get them to sort automatically.
For this example I’ve used the Sample – Superstore – English (Extract) dataset which comes standard with Tableau Desktop. Because this dataset doesn’t contain webanalytics data I’ve used similar data such as Order data, Category and Sales.
Setup
So let’s setup the worksheet.
Drag “Order Date” on the Columns shelf and select the Discrete Month/Year option. Drag “Order Date” on the Filters shelf, also select Month/Year and only select the months you would like to compare. I’ve used November and December of 2013. Drag “Category” to the Rows shelf and drag “Sales” to Text in the Marks card. This should give you the sales of each category for both November and December 2013.
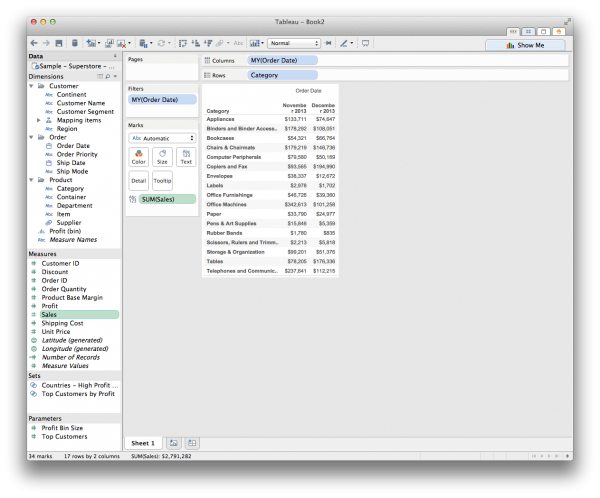
Setup Tableau worksheet
Quick Table Calculation – Percent Difference
Right click on the SUM(Sales) pill in the Marks card and select Quick Table Calculation > Percent Difference.

Tableau Quick Table Calculation

Tableau Percent Difference
This should give us the percent difference for each category for December compared to November. You could also select “Difference” which will show the absolute difference instead of a percentage.
Automatic sorting on absolute values
Now let’s make sure this is sorted correctly (independent of positive/negative change).
Ctrl click the SUM(Sales) pile in the Marks card and drag it to the Rows shelf, on the right of the Category pill. Right click the SUM(Sales) in the Rows shelf, select Discrete and drag the pill to the left of the Category. This will cause Tableau to sort the table by the first field which is now our percent difference. Don’t worry if your table looks funky, we’ll fix that.
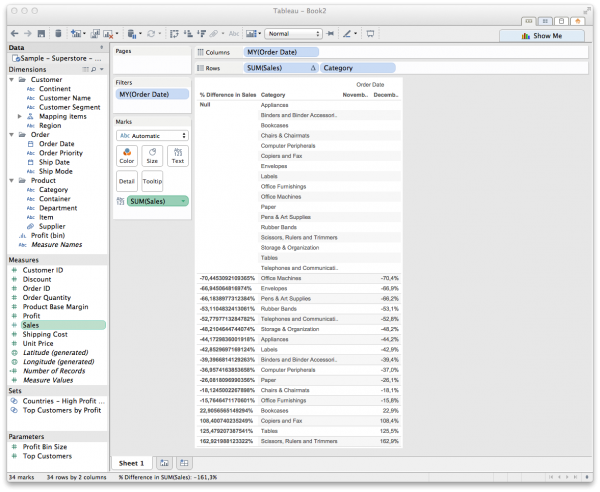
Tableau Sorting Percent Difference
Right click SUM(Sales) in the Rows shelf and select “Edit Table Calculation” then select “Customize”.
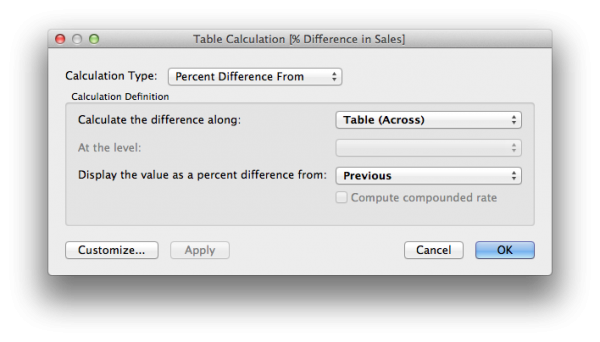
Tableau Customize Quick Table Calculation
Rename to “Sales Percent Difference for Sorting” and use the following formula:
-LOOKUP(ABS((ZN(SUM([Sales])) - LOOKUP(ZN(SUM([Sales])), -1)) / ABS(LOOKUP(ZN(SUM([Sales])), -1))),LAST())
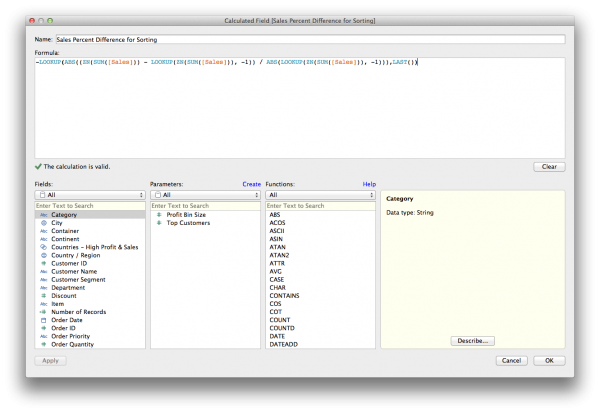
Tableau Sales Percent Difference for Sorting
Notice that this is a negative Lookup because we want the sort with the highest number first. By making the formula absolute (ABS) both positive and negative change are treated equal in this sort. This should give the following result.
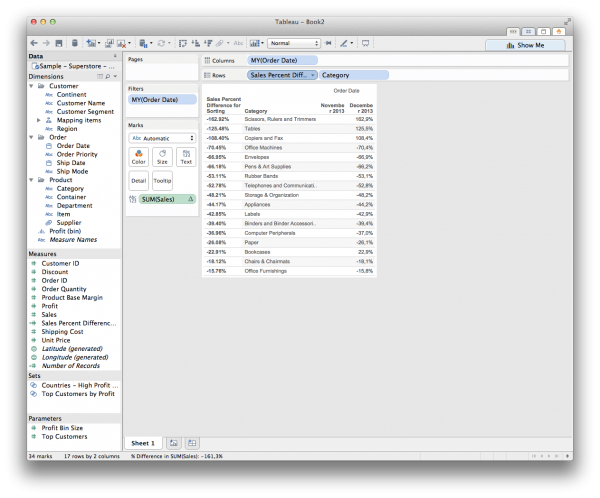
Tableau Result Percent Difference Sort
Clean up
Now let’s clean this view up. We have no need for the sorting field to be visible so we can hide it by right clicking on “Sales Percent Difference for Sort” pill in the Rows shelf and unselect “Show Header”.

Tableau unselect show header
We also have no need for displaying the column “November 2013” as only the column “December 2013” holds values. Right click the column header for “November 2013” and select “Hide”.

Tableau Hide Column
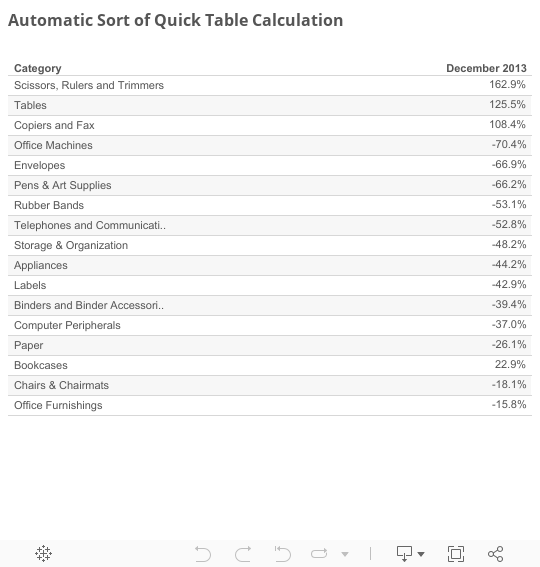
This should give you the following result. You can download this workbook from Tableau Public by clicking download on the bottom right just above the Tableau logo.
What are your thoughts?
How do you use Tableau? Do you have any other techniques for creating this view within Tableau and what are your best practices? Feel free to leave them in the comments!
Thanks, this is the best walkthrough I’ve found. Very helpful!
Hi Martijn, Thanks for sharing this blog.Tableau provides extensive sorting capabilities. However, when sorting data where Quick Table Calculations have been used, we may get results that we do not expect. I would like to suggest all the newbies who are seeking more info to visit this link-
Thank you ! This was very helpful and answer to my problem.
Good day
I would like to create a calculation to calculated the Gross Revenue . To calculated the Gross Revenue I calculate the Sales Amount(Actual) + Sales Costs. The sales costs consists of Rebates , Promotions, FOBB(Free On Board) to name a few.
However in Navision the Sales Costs is a negative value and the Sales Amount(Actual) is a Positive value.
My calculation in Tableau is:
Sum([Sales Amount(Actual)])+sum([Sales Costs]) and the Gross Value I need to get is R6,217,009.61 but I get a value of R4,724,972 which Is not the correct value. What should be the correct calculation to get the correct Gross Revenue value.
Hi Jason, In principal it seems that your calculation is correct but this might depend on the structure of your data. Could you share a sample of your data structure that Tableau is using (with dummy data)?
The lookup formula for sorting was very useful. Thank you!
Hello Martijn, I don’t see ‘customize’ option available in Tableau 9.2 version. How shall I proceed in this scenario?
Hi Rohit, this feature has been changed in Tableau 9.2. You can now just drag the field from your marks card or rows/columns to Measures in your datapane. It will create a copy of the field including the table calculation which is the same as was previously done using the customize button.
Hi Martijn,
Thanks for your post! I’m looking to do something slightly different. I have two separate measures – beginning dollar amount, ending dollar amount. How can I find the percent difference between the two measures?
Hi Shruti, thank you for your question. Would a calculated field work in your scenarie? ie.
(SUM([Ending Dollar Amount])-SUM([Beginning Dollar Amount]))/SUM([Beginning Dollar Amount])Hi Martijn,
I have a table calculation- Percentage difference from on CNT(Order Date).
My Row Shelf has Category and column shelf has month(Order Date). By following the steps you posted I am able to sort only the latest month selected in the data. The User wants to sort by individual month in descending order (By selecting the required month to be sorted in the parameter). How to enable this feature. Please let me know if there is any solution for this problem.
Hi Martijn Verstrepen,
I have a doubt about how to sort in ascending or descending order on a table calculation on difference column.
The problem is like this: I have a workbook of top depleters and gainers and I want a solution about how to sort the difference in the amounts of the last two days.
I am doing manual sorting but is there a calculation field or something that can make things easier.
Hi Deepan,
Do you really need a table calculation? If you only want to show one column with the percent change between the last 2 days you could just use a normal calculated field like this:
(IF [DateField]=DATEADD(‘day’,-1,TODAY()) THEN [YourMeasure] END – IF [DateField]=DATEADD(‘day’,-2,TODAY()) THEN [YourMeasure] END) / IF [DateField]=DATEADD(‘day’,-2,TODAY()) THEN [YourMeasure] END
Hi Martijn,
First of all what a great post. Thank you very much for sharing.
Just a quick question. What if I want to display only the first n biggest changes from this dashboard? Is it feasible?
Thanks in advance!
Jose
Very good post! We willl bbe linking to this great article on our website.
Keep up tthe good writing.
Build muscles site bodybuilder