Talk Data To Me

Data Visualization Tips & Tricks

Data Visualization Tips & Tricks by Martijn Verstrepen
  • Email
  • Facebook
  • Google+
  • LinkedIn
  • Twitter
  • YouTube

Powered by
Tableau Gold Partner - The Information Lab

#MakeOverMonday Week 2 2017

January 9, 2017 by Martijn Verstrepen Leave a Comment

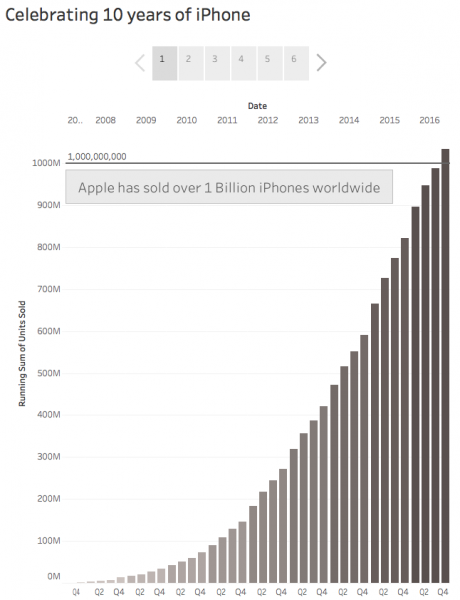
For week 2 of #makeovermonday I looked at the iPhone sales per quarter since the launch of the first iPhone. This week I decided to create a Tableau Story highlighting some of the interesting insights I found in the data. I looked at the total of units sold (over 1 Billion!), I highlighted seasonality in the data and looked at the percent change compared to the same quarter last year. You can view the interactive visualisation by clicking on the image.

#MakeOverMonday 2017 Week 2

#MakeOverMonday 2017 Week 2

Filed Under: makeovermonday, Tableau Public, Tableau Software

About Martijn Verstrepen

Data aficionado. Co-founder of The Information Lab Netherlands. Follow me @mverstrepen and check out our corporate website (Dutch)

Leave a Reply Cancel reply

Your email address will not be published. Required fields are marked *