Talk Data To Me

Data Visualization Tips & Tricks

Data Visualization Tips & Tricks by Martijn Verstrepen
  • Email
  • Facebook
  • Google+
  • LinkedIn
  • Twitter
  • YouTube

Powered by
Tableau Gold Partner - The Information Lab

#MakeOverMonday Week 3 2017

January 16, 2017 by Martijn Verstrepen Leave a Comment

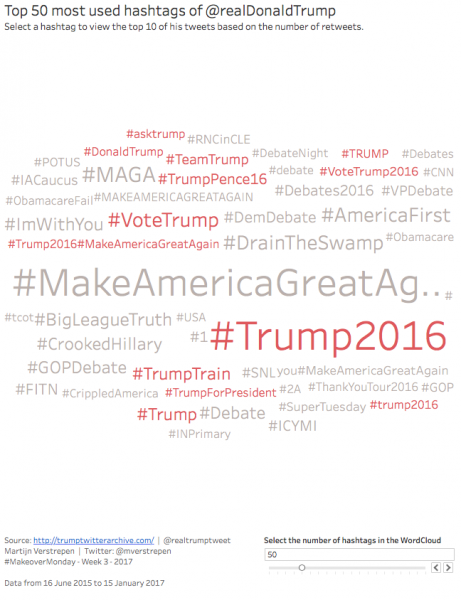
This week in #makeovermonday we looked at the tweets of President Elect Donald Trump gathered by the Trump Twitter Archive. I decided to have a look at the hashtag trump is using and how ofter they get retweeted. To do this I split the content of the tweets on the space character and then pivoted those fields to get a single column with the individual words in the tweets. I used that data in a Wordcloud highlighting those that contain the word “Trump” in a different color. By selecting any of the hashtags you can see a top 10 list of the tweets they were used in. You can view the interactive visualisation on Tableau Public by clicking on the image.

#MakeOverMonday 2017 Week 3

#MakeOverMonday 2017 Week 3

Filed Under: makeovermonday, Tableau Public, Tableau Software

About Martijn Verstrepen

Data aficionado. Co-founder of The Information Lab Netherlands. Follow me @mverstrepen and check out our corporate website (Dutch)

Leave a Reply Cancel reply

Your email address will not be published. Required fields are marked *